File menu> Save Timing Diagram
When you save a Timing Diagram:
•Each motion has a Motion name-tab
•The graphs are above each other.
•There is a straight-line between the position values of each .lines between the position values of each in the Motion.
How to export and show a Timing Diagram in Excel
STEP 1: MechDesigner - Save the Timing-Diagram.
A: Do:
We save a CSV file-type with:
•the number of Blend-Points in each motion
•each motion name
•the X-axis and Y-axis values of each Blend-Points in each motion
We do not save the:
•motion-law (Cam-Law)
•the Velocity, Acceleration, or Jerk values. |
STEP 2: Microsoft Excel
A.Find and open:
<LocalAppData> \ TimingDiagram.xlsm
or
<CommonAppData> \ Timing Diagram.xlsm
B.If necessary, enable macros
C.Select the Motion data worksheet
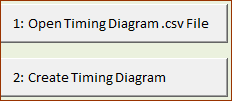
There are two buttons:
C.Press
D.Find and open the CSV file you have saved to your hard drive - see STEP 1, above
Note:
Reformatting of the data, if required:
The format of the Y-axis data for Motion0 moves the plot of the Timing-Diagram slightly to the right.
Change the format of all numbers with Excel > Home tab > General group > Format drop-down box to “General”.
|
D.Press
E.Look at the Timing Diagram worksheet to see the timing diagram of each motion.
Example Timing Diagrams in Timing Diagram worksheet.
See the note above, if the format of the Y-axis of Motion0 is not correct.
 Typical Timing Diagram with 2 Motions |
|