Plot the Epitrochoid Curve: Position equations
The Epitrochoid-Curve is a good example. You can compare the Epitrochoid Curve you get from the parametric equations that you enter in the the Math FB to the Epitrochoid Curve you can get from a Gear-Pair.
•The Epitrochoid-Curve given by a Gear-Pair is correct - it is found by MechDesigner!
•The Epitrochoid-Curve from the Math FB is correct - only when the equations are correct.
See Tutorial 14 : Epitrochoid Curve given by a Gear-Pair.
Parameters and Parametric Equations
We will add parametric equations to a Math FB to calculate separately the X and Y coordinates of the Epitrochoid-Curve. One equation will calculate the X–axis coordinates. A different equation will calculate the Y–axis coordinates. |
|
|
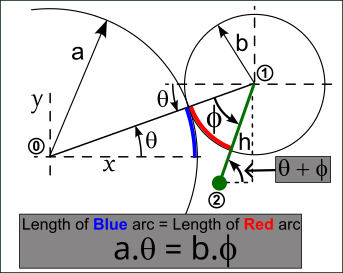
The parametric equations for the family of Epitrochoid curves are:
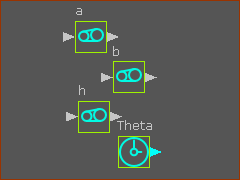
Px = (a+b)*cos(Θ) – h*cos((a+b)/b)*Θ) Py = (a+b)*sin(Θ) - h*sin((a+b)/b)*Θ) Parametric-Constants a = radius of the fixed circle b = radius of the rolling circle h = distance to the point 2, from the center of the rolling circle Independent-Variable Θ = the independent variable: 0 to 360 (0 or 2×Π) |
The parametric equations, above, give the family of Epitrochoid Curves. Thus, if you change a Parametric-Constant - a, b, or h - you will plot a different Epitrochoid-Curve. To enter parametric-constants in the Math FB, use one of these methods: Method 1 Enter the actual values for the Parametric-Constant - a, b, h - explicitly in the Math FB dialog. To plot a different Epitrochoid Curve, you must open the Math FB dialog to edit the parameters again. Method 2 Add three Gearing FBs and connect wires to the inputs of the Math FB. Edit the Add after Gearing Ratio parameter. The output from the Gearing FB may need to be divided by 1000. To plot a different Epitrochoid Curve, edit a Gearing FB to edit its parametric-constant. Method 3 Add the parameters in the Gearing FB to a Design-Set. |
|
Piggyback Sliders and Parametric Equations.
 |
|
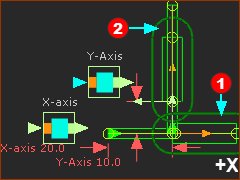
It is convenient to use Piggyback Sliders - one Slider for each set of Parametric Equations
The Piggyback Sliders are now in the graphics-area. |
Add a Math FB and Open the Math FB dialog
|
Add a Math FB
The Math FB is now in the graphics-area. Open the Math FB dialog
The Math FB dialog is now open. |

How many Input-Connectors and Output-Connectors?
|
|||
|
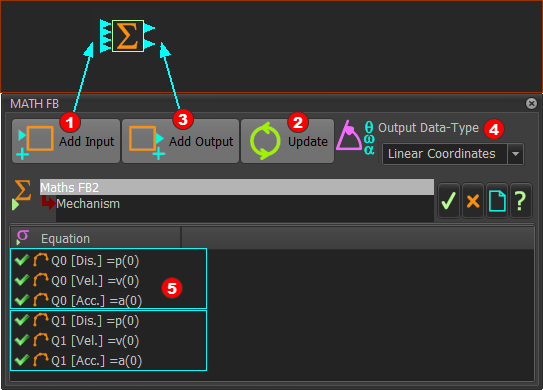
Input-Connectors There are three(3) Parametric-Constants (a, b, h) , and the Independent Variable () STEP 1: Add four(4) input-connectors:
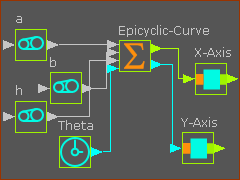
Output-Connectors We need two(2) output-connectors to output the motions for the X-axis Slider and the Y-axis Slider. STEP 2: Add one(1) output-connector to give a total of two(2) output-connectors:
|
||
Output Data Type Use Output Data Type to change the units at the output to Linear Coordinates. STEP 3: Change the Output Data Type to Linear Coordinates:
|
|||

Default Equations, Data-Channels, Input-Connectors and Output-Connectors
Input-Connectors
Output EquationsEach equation evaluates one Data-Channel for one Output-Connector. Because each Output-Connector has three Data-Channels, there are three equations that evaluate the top output-connector.
|
POSITION : Parametric Equations in the Math FB
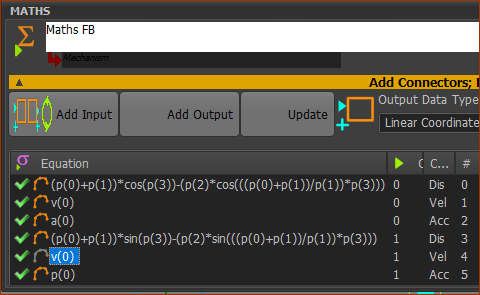
STEP 1: Enter the Parametric Equations for the two output-connectors
|
|
The equations in the Math FB are now:
|
Function-Blocks for the Parametric-Constant and the Independent Variable
|
Define the 3 Parametric-Constants
Note: I have entered a = 120, b = 40, h = 40 <<< Gearing FB dialog : Add after Gearing Ratio for the Parametric-Constant 'a' Add the Independent-Variable
Connect the FBs
Add a Trace-Point
|
||||
 Gearing FB: Add after Gearing Ratio parameter |
|||||
|
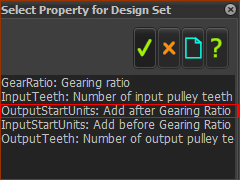
Add a Design-Set - select the 3 Parametric-Constants
|
Add a Design-Set and add to it the three Parametric-Constants.
|
Video - to show the Epicycloid-Curve family
Epitrcohoid Curve - Position Equations Only |
If we enter 120 for Parameter a, we can enter 60, 40, 30, 20, 10 as factors for Parameter b. Each will give a continuous, endless, Epitrochoid-Curve. •If Parameter h = b, there is a cusp in the Epitrochoid-Curve. •If Parameter h > b, there is a loop in the Epitrochoid-Curve |
