Graph FB > Settings
How to open the Graph-Settings
|
1.Click Graph toolbar > Graph Settings icon in the Graph toolbar to open the Graph Settings dialog. The settings are: •Graph Title / Name •Color of each graph line •Maximum and Minimum scale for each Y-axis •Maximum and Minimum scale for the X-axis |
Graph-Settings dialog

Graph-Settings dialog
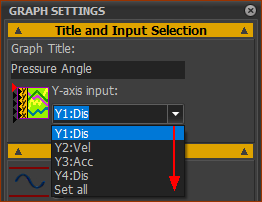 |
Graph Title The Graph Title - for example, Pressure Angle, shows above the graph plots. |
Y–axis Input Click the drop-down to select for which Y-axis Input you want to edit You can select: •Y1 to Y4 or •Set all : to apply the same Y-axis and X-axis settings to ALL Y-axis inputs. |
|
|
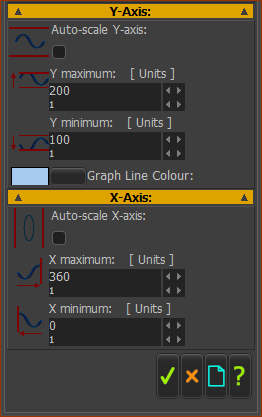
The Y-axis parameters apply one the Y-axis Input or ALL Y-axis Inputs (if you select Set all)- see Title and Input Selection Y-axis: Auto-Scale Y-Axis: check-box ☑Auto-scale Y-minimum / Y-minimum values for a Y-axis input ❑Enter the Y-maximum and Y-minimum values for a Y-axis input Enter values for Y maximum and Y minimum when the Auto-Scale Y-axis check box is Clear Graph Line color: Click the button and use the Windows® pop-up color picker to select a different color. Top Tip 1: Select Set all in the Y-axis Input drop-box, and set the Maximum and Minimum for the all of the Y-axes to be equal for all graphs. For example: the wire to all of the input-connectors is Pressure-Angle from different 2D-Cams. Then, it is easy to see on the graph which 2D-Cam exceeds the limits for Pressure-Angle. Top-Tip 2: The Radius-of-Curvature of a 2D-Cam can be a very large value. The large values are not important. The small values are more important. Set the Maximum and Minimum values at approximately 3 × the radius of a Follower-Roller. X–axis: The X-axis values apply to all graph plots. Auto-Scale x-Axis: ☑Auto-scale the X-maximum and X-minimum values for the X-axis. ❑Enter the X-maximum and X-minimum values for the X-axis |