Graph FB
see Add Graph FB
Use a Graph FB to plot Kinematic Motion-Data, Kinetostatic Force-Data, and Cam-Data over one machine-cycle.
There are:
➔4 × Y-axis input-connectors: the top four(4) input-connectors.
➔1 × X-axis input-connector: the bottom input-connector controls the X-axis for all of the graphs.
If you do not connect a wire to the X-axis input-connector, the X-axis is one machine-cycle, 0 – 360.
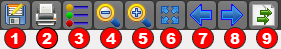
How to open the Graph Interface
|
To open the Graph FB dialog
|
|
The Graph interface is now open. |
||
Graph Interface

Grap dialog/interface
![]() Y–axes: Colors and Scales
Y–axes: Colors and Scales
There is one Y-axis scale for each wire that you connect to an Y-axis input-connector. Maximum = 4 Y-axis scales | Left > Right >>> are for the Wires at each Y-axis input-connector | Top > Bottom. •The color of the Y–axis scale and the plot are the same. Edit axis colors in Graph Setting dialog. •The Y-axes (and X-axis) auto-scale to the maximum and minimum values of the data at the input-connector. Edit Minimum / Maximum scales values with Graph Setting dialog. |
![]() Y–axis: Data-Channels (Drop-Down): See also Y–axis Data-Channel Display Options
Y–axis: Data-Channels (Drop-Down): See also Y–axis Data-Channel Display Options
Each wire that you connect to an input-connector has up to 3 Data-Channels. Click the drop-down arrow to select which Data-Channel to plot for each wire. |
![]() Digital Readout (D.R.O.):
Digital Readout (D.R.O.):
The X–axis value and the Y1-axis to Y4-axis values in the Digital Readout are those values of the graph at the position of the vertical cursor The Number-Format for the X–axis and Y–axis values are configured in Edit menu > Application Settings | Number Format tab. |
![]() Graph Area:
Graph Area:
There is a graph for each wire you connect to a Y-axis input-connector. |
 |
|
![]() Vertical-Cursor
Vertical-Cursor
When you click or drag your pointer in the graph-area •the Vertical-Cursor moves with your pointer •the Digital-Readouts •the Master Machine Angle continuously updates to equal the X-axis value of the Vertical-Cursor •the kinematic-chains that are kinematically-defined move to agree with the Master Machine Angle. |
![]() Graph Data in Clipboard
Graph Data in Clipboard
To list the graph data-values in 1.Click the right-most icon in the Graph toolbar There is one data-point for each Machine Step - see Machine-Settings dialog > Number-of-Steps. You can Paste the data: •to Excel, or Notepad, ... •to the MotionDesigner Data-Transfer Table From the Data-Transfer Table, you can paste the data: •as a dumb Overlay-Trace to compare it with a motion •to a Position List, Acceleration List, or Z Raw Data segment-type, and link it to a Motion-Part or Motion-Point. |
Y-Axis Data-Channels:
Each wire that you connect to a Graph FB has three(3) data-channels. Use the drop-down arrow to select which Y-Axis Data-Channel The Data-Channels that are available are a function of the Function-Block and wire you connect at the input to the Graph FB. Data-Channels: Kinematic Function-Blocks (Linear-Motion, Gearing, Motion, Motion-Dimension) you can plot: •Linear or angular position •Linear or angular velocity •Linear or angular acceleration Measurement FB or Point-Data FB you can plot: •Linear or angular position •Linear or angular velocity •Linear or angular acceleration •Pressure Angle. •Radius-of-Curvature. •Contact Cam Force •Maximum Contact Shear Stress. •Sliding-Velocity The output form a Force-Data FB is a function of the element with which it is linked. See Force-Data FB dialog If you link a Force-Data FB to a: ŸPin-Joint with a Motor, you can plot the Application Load. ŸSlide-Joint with a Motor, you can plot the Application Load ŸJoint that does not have a Motor, you can plot: ☑Total Force ( FT = √(FX2 + FY2) ☑Force along the X-coordinate of a Point: FX ☑Force along the Y-coordinate of a Point: FY Ÿ2D-Cam: you can plot the Cam Contact Force ŸSpring FB: you can plot the Total Force, X Force, Y Force acting on the Anchor-Point. |
Why are the Y–axis values in the DRO different to the vector-values in the main graphics-area?
The values may be slightly different because, in the graph, the X–axis and Y–axis values at the D.R.O. must jump from 'machine -step' to 'machine-step'. See Machine Settings dialog > Number-of-Steps. In the graphics-area, the vector values are calculated for the value of the Master Machine Angle, which may not coincide with a machine step. |