Overlay-Trace
Show the data that is in the Data Transfer Table as a dumb graph together with the active Motion.
The dumb graph is the Overlay-Trace.
Note:
The MTD or ZXL file-types do not save the Overlay-Trace or the data in the Data Transfer Table.
If the data is important, and the data is not available from a Motion graph or a Graph FB (MechDesigner) then we recommend that you put the data to a new Motion of one segment that is a List Segment-Type. Also, rename the new Motion to Overlay-Trace, or a name to remind you that the data is intended for an Overlay-Trace in a different motion.
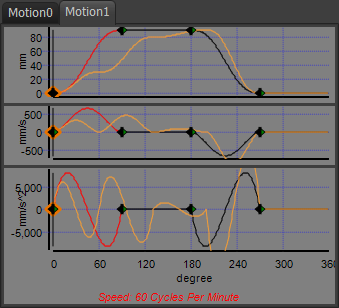
 Position, Velocity, Acceleration motion-values for Overlay-Trace.  Overlay-Trace (in Orange) and the active Motion |
|||||
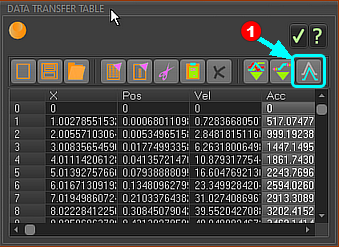
To show an Overlay-Trace
To hide the Overlay-Trace:
To edit the color of the Overlay-Trace
|
Prepare the Data for an Overlay Trace
The data in the Data Transfer Table should be arranged as follows: •Data in Column 2, from Row 0, displays in the Position graph. •Data in Column 3, from Row 0, displays in the Velocity graph. •Data in Column 4, from Row 0, displays in the Acceleration graph. •Data in Column 5, from Row 0, displays in the Jerk graph. Note: •The Overlay-Trace shows even if the data in Columns 2,3,4,5 are not motion-derivatives of each other. •The Overlay Trace shows only for each column of data in the Data Transfer Table - we do not calculate other motion-derivatives for you. |
Overlay-Trace example:
To show the motion-values of Motion0 as an Overlay Trace in Motion1. If necessary: 1.Click File toolbar > Add Motion to add a Motion1 as a new motion name-tab 2.Click View toolbar > P, V, A, J buttons to show all motion-derivatives in Motion1 3.Click Motion0 name-tab to make it the active motion 4.Click View toolbar > P, V, A, J buttons to show all motion-derivatives in Motion0 Open the Data Transfer Table. 5.Click Blend-Point and Segment Editor toolbar > Data Transfer Table. Get the motion-values from Motion0 into the Data Transfer Table. 6.Click Data Transfer Table > Get Motion Data. The Data Transfer Table fills with the motion-values for each motion-derivative in Motion0. Make Motion1 the active motion. 7.Click Motion1 name-tab to make it the active motion Show the data that is in the Data Transfer Table as the Overlay-Trace in Motion1. 8.Click Data Transfer Table > Overlay Trace button The motion-values of Motion0 are now an Overlay Trace in Motion1. 9.Click in the Graph of Motion1 to re-scale Motion1 and the Overlay Trace. The graphs rescale to show the maximum and minimum of the Motion1 and the Overlay-Trace. |