Point-Cloud FB
Do two steps in the Point-Cloud dialog:
STEP 1: Import-data (TXT file-type).
For example, import the X,Y coordinates of a cam-profile which you have measured with a Coordinate Measurement Machine (CMM).
STEP 2: Fit-a-Curve to the data
We fit for you a smooth Curve to the data that you import, with a Fourier Harmonic-Series.
You specify the accuracy you want, and edit the number of harmonics until the error between the curve we create and the original data is less than the accuracy.
|
To open the Point-Cloud dialog:
|
|
The Point-Cloud dialog is now open. |
||
Point-Cloud dialog
 Point-Cloud dialog |
STEP 1: Import DataSTEP 2: Fit Curve to Data |
 STEP 1: Import Data
Do A, B, and C. |
||||||||||||||||||
Import and Browse buttons  Example File Format |
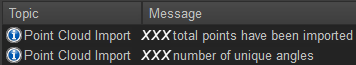
A. Browse... Click the Browse... button to find a data-file. The data-file must by an ASCII, or TXT file-type. The file-name you select shows in the Data-File (read-only) box. A preview of the data in the file is in the box below. B. Edit File-Format Any Header in the data-file is not imported. The data should be rows of data-points - see Data-Points below You can remove extra data from columns/rows with the Edit File-Format box. See File Formats below. C: Import button When the File Format is correct (see below), click the Import button to import the Point-Cloud data-file. We plot for you the Point-Cloud on the Part to which the Point-Cloud FB is a child. The Point-Cloud plot is a continuous line in the graphics-area. See also: Messages |
|||||||||||||||||
Data-Points
|
||||||||||||||||||
 Optional: Data Offset and Scale option |
Options:x , y When you add a Point-Cloud, you select a Part. The Part has an origin - its start-Point - where its XY coordinates are (0,0) If the origin of the Point-Cloud has an offset relative to the origin of the Part, you can remove the offset. Enter -X, -Y, the negative of the offset. Or, to offset the Point-Cloud, by (X,Y), enter (X,Y) values. File Rotary Units ; File Linear Units Select the units that match those of the original Point-Cloud data-file. |
|||||||||||||||||
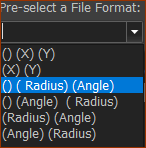
File Formats:Pre-Select a File Format To help you with the formatting, you can use the Pre-Select a File Format from the drop-down list-box.
When any of these formats do not represent the format of the data in your data-file, then edit the format in the Edit File Format box directly. Example: Data-Files and File-Formats and Enter File Format.
 |
||||||||||||||||||

STEP 2: Fit Curve to Data
When you import Point-Cloud data, the chart
 Point-Cloud dialog > Fit Curve to Data tab |
||||
Parameters
Steps to do in Fit Curve
Velocity and Acceleration Graphs and Filter Width
|
We plot the Point-Cloud and the Curve as a Position graph. If you want to plot them as Velocity or Acceleration ( Even if the Fit Quality = 1, you can continue to increase # Harmonics to improve the fit of the Velocity and/or Acceleration Curve to the Point-Cloud. However, we recommend the Maximum # Harmonics = # Points in the Point-Cloud/3. If the plot of the Velocity or Acceleration data is noisy you can smooth the noise (remove the noise) with the Filter-Width |
Original Data Accuracy
Thoughts: •Consider an Original Data Accuracy of 0.1, then reduce it to approximately 0.001. •Do not enter a value that is more accurate than the original accuracy of the data. For example, if the data is to 2 d.p., then 0.05 OK, and 0.001 is a minimum sensible value. However, experiment, as you may find that more accuracy gives you better results. •Is the skill of the person that measured the Cam-Profile a factor? •Is the Cam-Profile clean? Is the Cam-Profile worn? Is the Cam-Profile damaged? Machine Measurement Accuracy Approximations: per 100mm Diameter of Cam Diameter: •Temperature-Controlled (18-22ºC) CMM approximately 0.2 - 2µm •Non-temperature-controlled CMM approximately 2 - 10µm (~h4 for a 100mm shaft) •Portable CMM approximately 5 - 20µm (~h5-h6 for a 100mm shaft) •Test Rigs are variable, but you should aim for approximately 20 - 100µm (~h8-h9 for a 100mm shaft) |