Polynomial-Fit FB
See also: Add Polynomial Fit FB
We recommend you save your work before you use this tool.
And immediately save it again with a new file-name.
About Polynomial FB
 |
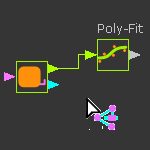
The Polynomial Fit FB finds a concatenated series of Polynomials (5th order) that are approximately equal to the data at its input-connector. After you do a Polynomial-Fit, you can: •Transfer Polynomials directly to MotionDesigner as a new Motion name-tab. •Connect a wire from the output-connector of the Polynomial-Fit FB to the input-connector of a different FB. •Export the motion-values that you calculate as a text-file. •Export the values for position, velocity, and acceleration at the beginning and end of each polynomial segment as a CSV file. •Export the polynomials segments in a format suitable for the Schneider-Electric EPAS4 servo-controller. |
|
To open the Polynomial-Fit dialog:
|
|
The Polynomial-Fit dialog is now open. |
||
Polynomial-Fit dialog
 Polynomial-Fit FB dialog/interface. |
|
The Polynomial-Fit dialog:
|
 Acquire and Save toolbar
 Acquire and Save Results toolbar |
|
The toolbar buttons are:
|
 Analysis of Results
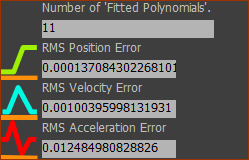 |
Number of Polynomials in Fit (read-only) The actual number of Polynomials we fit to the data at the input-connector. See also: Maximum Polynomial Count in the Settings for Polynomial Fitting Algorithms. RMS Position Error, RMS Velocity Error, RMS Acceleration Error (read-only). The RMS (Root-Mean-Square) error as a percentage, for each motion-derivative, between the Polynomials we fit and the data at the input-connector. |
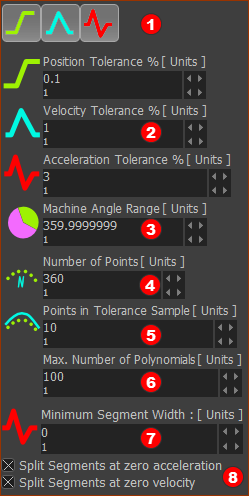
 Settings for Polynomial Fitting Algorithms
 |
|
Parameters to enter before you click Fit Polynomials to Data (button
|
 Graph toolbar
 |
|
The toolbar buttons are:
|
 Graph Legend
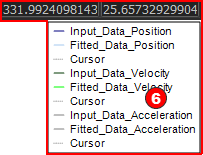 |
Graph plot color scheme for •original, or input, data •fitted data calculated from the fitted polynomials •each motion-derivative •Cursor - you can click ON a graph of each motion-derivative to show a cursor. The X-Y data-values of the active cursor is above the graphs. |