Graph FB
Terminology:
Graph FB : |
Connect wires to the input-connector of a Graph FB to plot, over a complete machine-cycle, any data that is available at the output-connectors of other Function-Blocks. |
Data-Channel : |
Each wire provides three parallel streams of data. For example, the data is linear or angular position, plus the first and second motion-derivatives. Each stream of data on a wire is a Data-Channel. |
Add Graph FB
STEP 1: Add a Graph FB to the graphics-area
The Graph FB is now in the graphics-area. STEP 2: Connect wires to the input-connectors of the Graph GB
STEP 3: Open the Graph FB
The Graph dialog is now open. STEP 4: See: Graph FB Interface. To review the kinematic, kinetostatic, and/or Cam data that you can plot with a Graph FB. |
|||||||
See also: |
|||||||
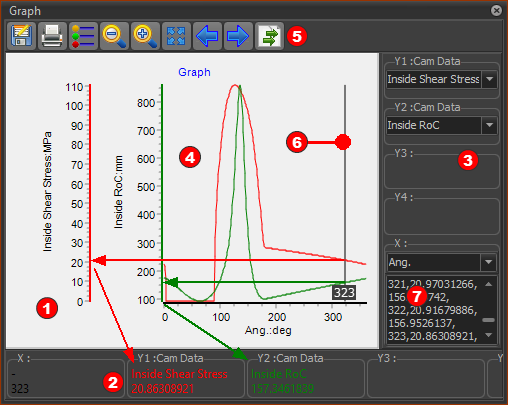
Graph FB Interface
|
|
Graph FB:
•A maximum of 4 scales, one scale for each wire that you connect to Y1 to Y4 input-connectors •The color of the Y–axis and the plot-line are the same.
•The X-axis and the Y1 – Y4-axis values at the position of the vertical cursor •The Number-Format for the X–axis, Y–axis, and data in Clipboard
•Each wire that is connected to a Y-axis orthe X-axis input-connector has up to 3 Data-Channels •Select the Data-Channel in the drop-down box - see Data-Channel Selectors •The color-coded graphs for each Y–axis input •Vertical-Cursor
•Save, Print, Graph Settings, Zoom Extents, Pan Left, Pan Right, Copy Graph Data to Clipboard – see
When you click in the area of the Graph When you drag your pointer in the graph : •the Vertical-Cursor follows your pointer •the Digital Readouts •the Master Machine Angle updates to the position of the Vertical Cursor •the kinematic-chains that are kinematically-defined move to a position that is defined by the Master Machine Angle.
•When you click the right-most icon in the toolbar •Paste this data to Excel, or •To MotionDesigner in the Data Transfer table. You can plot it as an overlay or use it as a Motion (use Z Raw-Data). Notes: •Configure the Number-Format for the X–axis, Y–axis, and 'Data in Clipboard' in Application Settings | Number Format tab. |
|
 Data-Channel Selectors:
Each wire you connect to the Graph FB has three Data-Channels. The data-channels that are available are a function of the FB from which you connector the wire to the Graph FB input-connector. Use the Data-Channel Selectors to select which of the three data-channels to plot. The data-channels from a: •Function-Block (Linear-Motion, Gearing, Motion, Motion-Dimension): oLinear position, velocity, acceleration. oAngular position, velocity, acceleration. •Measurement FB or Point-Data FB: oLinear position, velocity, acceleration of the Measurement dimension or Point's position. oAngular position, velocity, acceleration of the Measurement dimension. oPressure-Angle. oCam Radius-of-Curvature. oContact Cam-Force oMaximum Contact-Shear-Stress. oEntrainment Velocity If the Force-Data FB references a: oPin-Joint that is a Power-Source, you can plot Application-Torque for a Servomotor and Gearbox. oSlide-Joint that is a Power-Source, you can plot the Application-Load for a Linear Servomotor. oPin-Joint or Slide-Joint that is NOT a Power-Source: ▪ - Force in the X-axis direction : ▪ - Force in the Y-axis direction: o2D-Cam: you can plot the Contact Force between the Cam-Profile and the Follower-Profile. oSpring FB: you can plot the Total Force, the X Force and the Y Force acting on the anchor-Point of the Spring. TOP-TIP: To plot all three Data-Channels from the same output-connector of a Function-Block, 1.Drag three wires from the same output-connector of the Function-Block to three(3) different Graph FB input-connectors. 2.Select the different Data-Channels with the Y-axis Data-Channel Selector drop-down (right-side of graphs) |